How Nepal Custom Duty Is Calculated
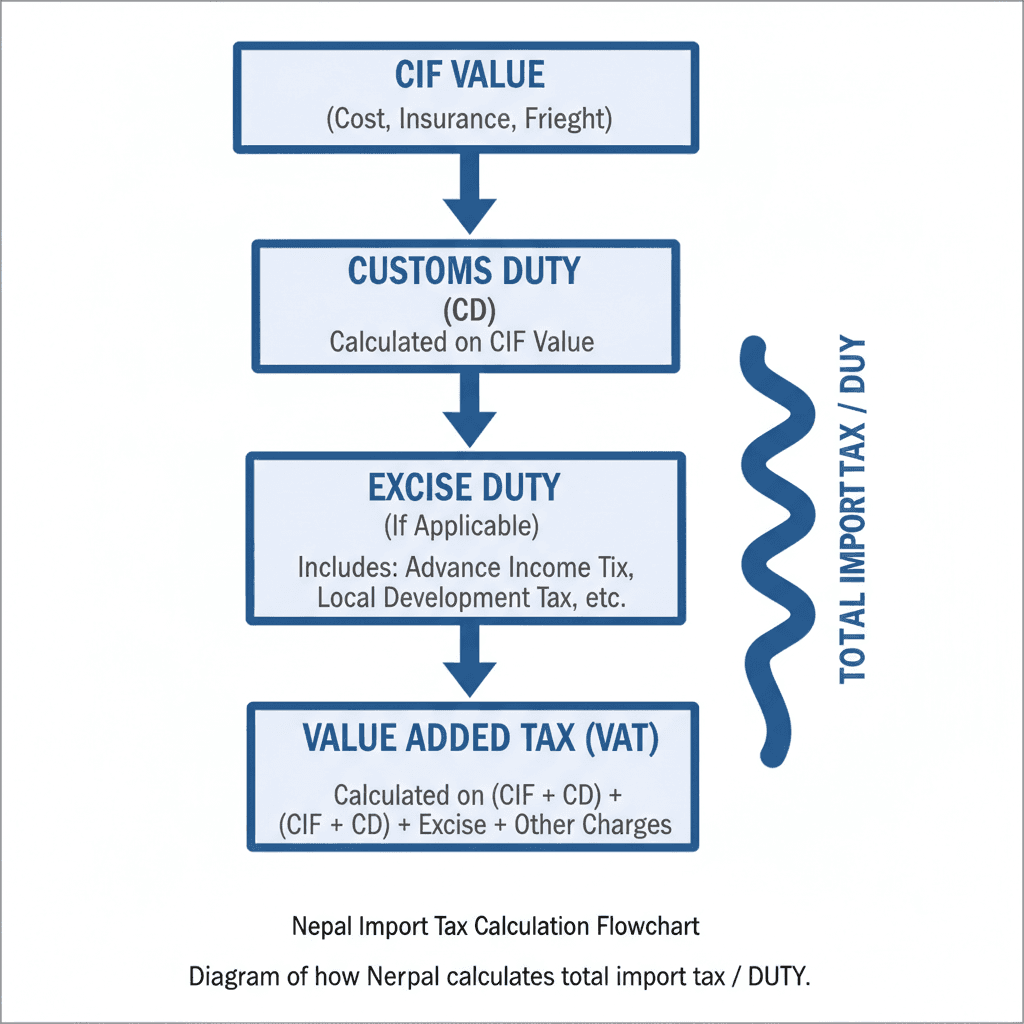
Nepal levies customs duty on the CIF value (cost, insurance, freight) of imported goods, then layers other taxes on top. A typical import bill includes:
- Basic customs duty – product‑specific rate from the official Customs Tariff 2081/82.
- Excise duty (on selected items) – applied on CIF plus customs duty.
- Agriculture reform / health risk / infrastructure charges – extra levies for specific categories such as fuel, luxury goods, or tobacco.
- VAT at 13% – charged on the sum of customs value + custom duty + excise and other applicable charges.
Example from 2025 guidance: a weaving machine import is taxed with a 5% basic customs duty plus 13% VAT on CIF plus duty, showing how total tax quickly climbs above the headline duty rate.
Typical Tariff Bands and Sector Rates
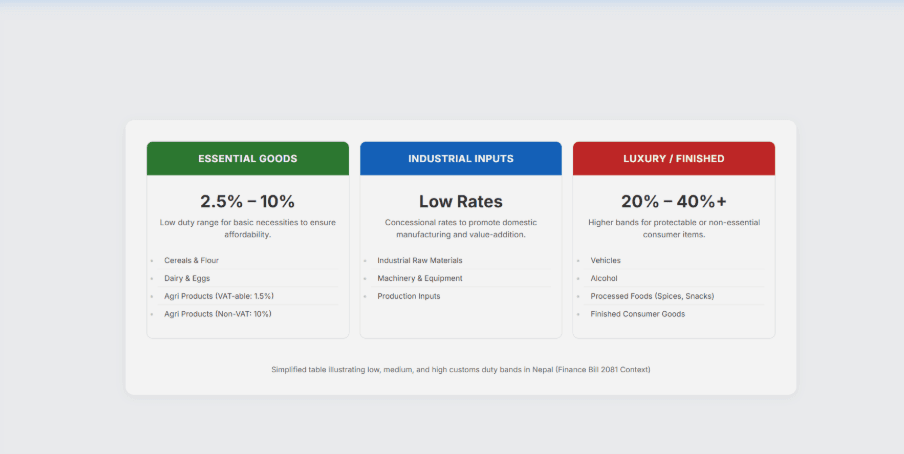
Nepal’s integrated customs tariff groups goods into “banding categories” with different ranges:
- Many essential foods (cereals, flour, some dairy and eggs) fall under 2.5–10% customs duty depending on whether they are VAT‑able or not.
- Certain agricultural and edible plant products are charged 10% duty for non‑VATable items and 1.5% for VAT‑able in some categories, reflecting policy to support domestic farming while easing raw‑material costs.
- Luxury or protectable goods (finished consumer items, vehicles, alcohol, some processed foods) sit in higher bands, often 20–40% or above, according to Finance Bill 2081 changes and the latest customs tariff PDF.
A recent Finance Bill 2081 update raised tariffs on some processed imports such as spices, snacks, and consumer goods, while either lowering or keeping low rates on industrial raw materials and machinery to promote domestic value‑addition.
Key 2025 Tariff Changes and Examples
Recent policy moves show how dynamic Nepal tariff rates are:
- A 2025 update on customs tariffs reduced duty on cashew nuts with shells from 15% to 10%, helping food processors.
- At the same time, import duty on mixed spices (masala) increased from 20% to 30% to encourage local spice blending.
- The Finance Bill 2081 restructured duties across agricultural inputs, medical supplies, and industrial raw materials with the twin goal of protecting domestic producers and managing the trade deficit.
According to trade analysis, about 10.55% of imports in the first month of FY 2082/83 entered at 0% duty, and imports charged at 5% duty made up roughly 20.87% of import value but only 7.91% of total duties showing how most customs revenue comes from higher tariff brackets.
Customs Duty’s Role in Nepal’s Revenue
Customs and VAT together are the backbone of Nepal’s tax system. Recent fiscal data shows:
- VAT contributed about Rs 27.6 billion (32.4%) of total tax revenue in an early 2025/26 period.
- Customs duties added around Rs 16.6 billion (19.6%), so VAT plus customs made up over 52% of all tax income.
- Trade data for FY 2081/82 indicates imports of roughly Rs 1,804 billion and exports of Rs 277 billion, with customs collected at around Rs 13.61 billion just in the first month of 2082/83 on imports of Rs 143.04 billion.
This heavy reliance on import‑based revenue explains why tariff policy is so sensitive: lowering duties can help traders and industry but forces the government to find revenue elsewhere.
Tools and Sources for Checking Current Nepal Tariff Rates
Because rates change through yearly budgets and special directives, importers should always verify live data instead of relying on old tables. Authoritative tools include:
- Department of Customs website – publishes official integrated tariff schedules and notices, including updated PDFs for FY 2081/82 and 2082/83.
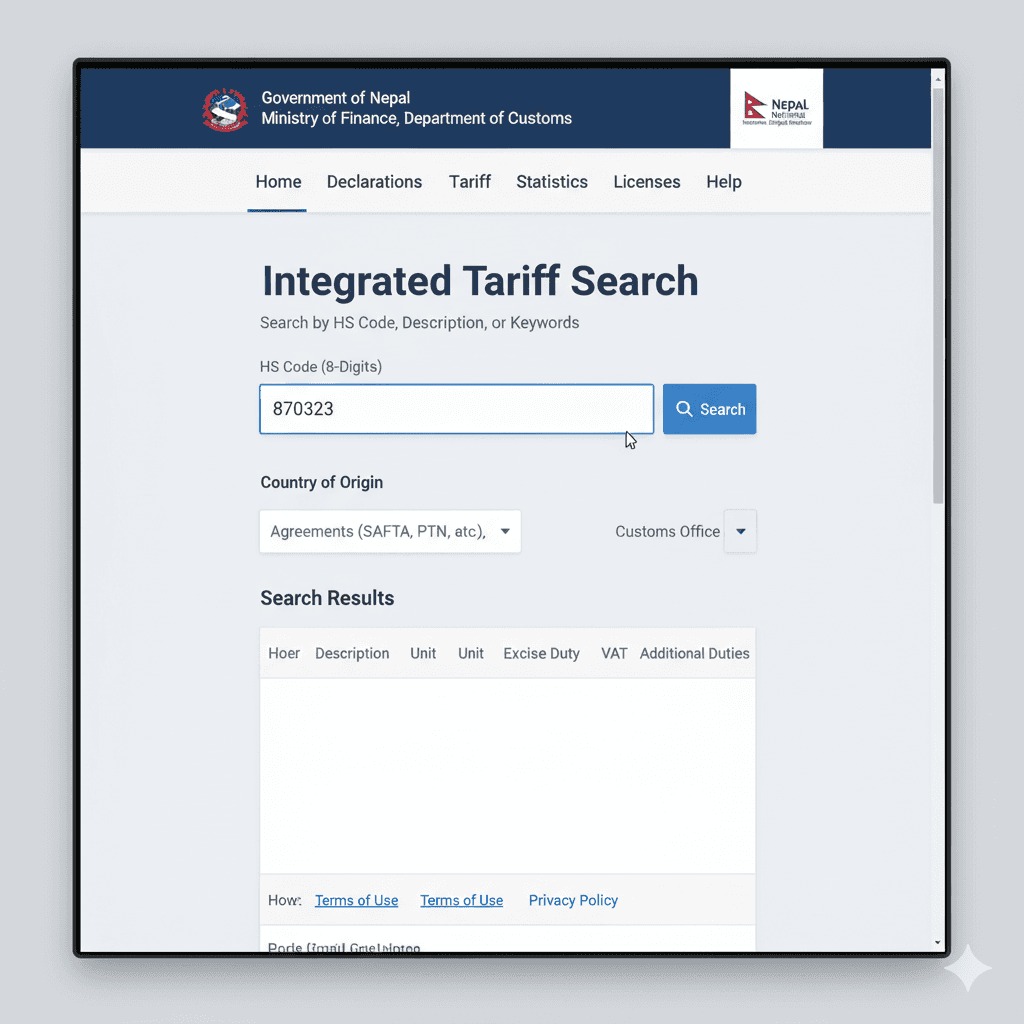
- Nepal National Single Window (NNSW) Tariff Search – allows HS‑code‑based look‑ups of current customs duty and related taxes online.
- Professional tax and customs guides – firms like PKF, Baker Tilly, and local tax consultants periodically release concise tax‑rate booklets summarizing customs banding, VAT, and withholding at customs points.
Policy analysts also track meta‑indicators such as the share of tariff lines with “international peaks” (rates more than three times the global average), which stood near 48% of tariff lines in earlier years reflecting how protective and complex parts of Nepal’s tariff structure remain.